

It’s no secret that everyone wants to rank as the top result on the first page for a given user query. However, this has got progressively more difficult due to the constant evolution of the Web and consequently - search engines.
Rank-improvement exploit strategies such as jamming a large amount of keywords inside of a text containing seemingly random sentences have become obsolete as search engines have started to pick up on these tendencies with Google being the most prominent example, given that it plays host to the largest share in percentages when it comes to user queries worldwide.
Search engines have strived to develop their algorithms in order to punish such techniques for years by taking into consideration factors such as links, overall user satisfaction, and as of recently - user experience, in an attempt to bring the highest quality websites to the forefront of the search engine results pages, commonly referred to as ‘SERPs’.
User experience in particular has been a focal point for discussion over the last couple of years ever since Google introduced the ‘core web vitals’ into their ranking algorithm. Webmasters were initially concerned that they did not have a way to identify possible improvement areas in order to fully satisfy these metrics. However, the search engine giant quickly responded by introducing the free web page evaluation tool known as ‘Lighthouse’.
In this article we are going to introduce and discuss Lighthouse as a tool, including how to locate and operate. Additionally, we are also going to provide some basic information as to what the different sections of a Lighthouse report actually mean and refer to so that you can begin to make changes to your website in accordance with the presented data, ultimately enhancing your overall user experience.
How to access the Lighthouse tool?
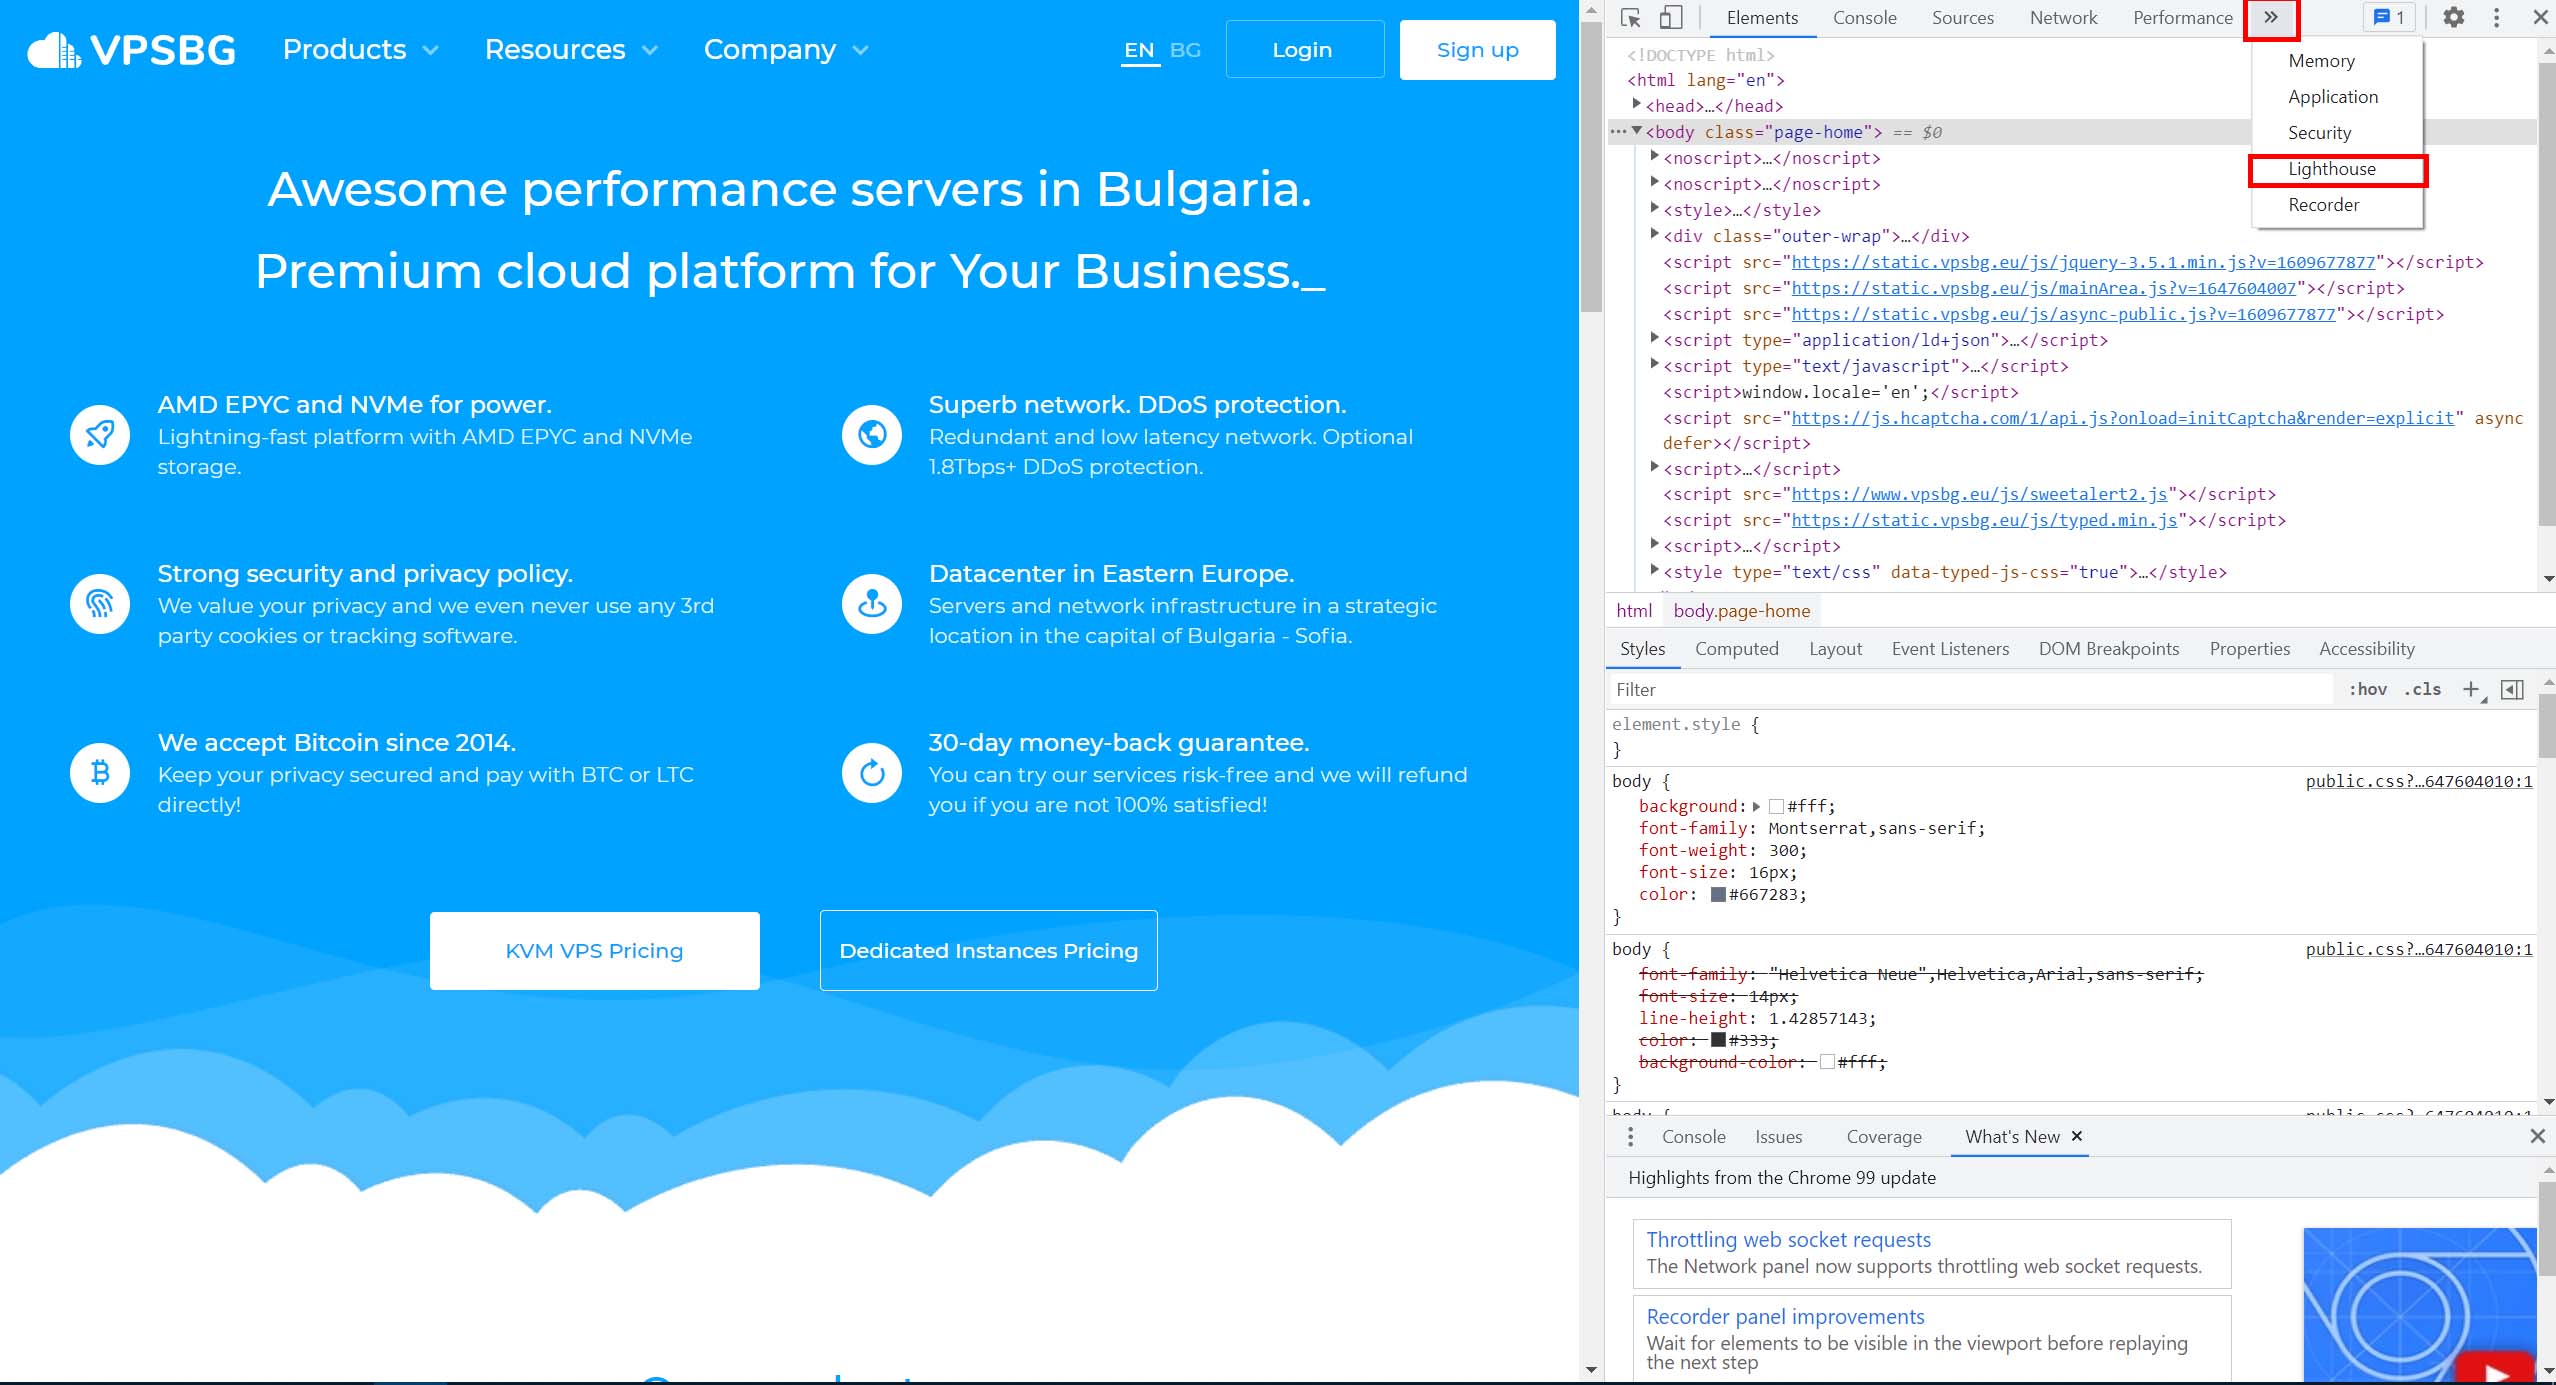
As we mentioned previously, the tool is completely free. If you are using chrome then you can easily access it from within your web browser by opening up the web developer tools using either the F12 key or the ‘Ctrl + Shift + C’ key combination on your keyboard. Google has also released Lighthouse as a downloadable extension for other browsers such as Firefox.
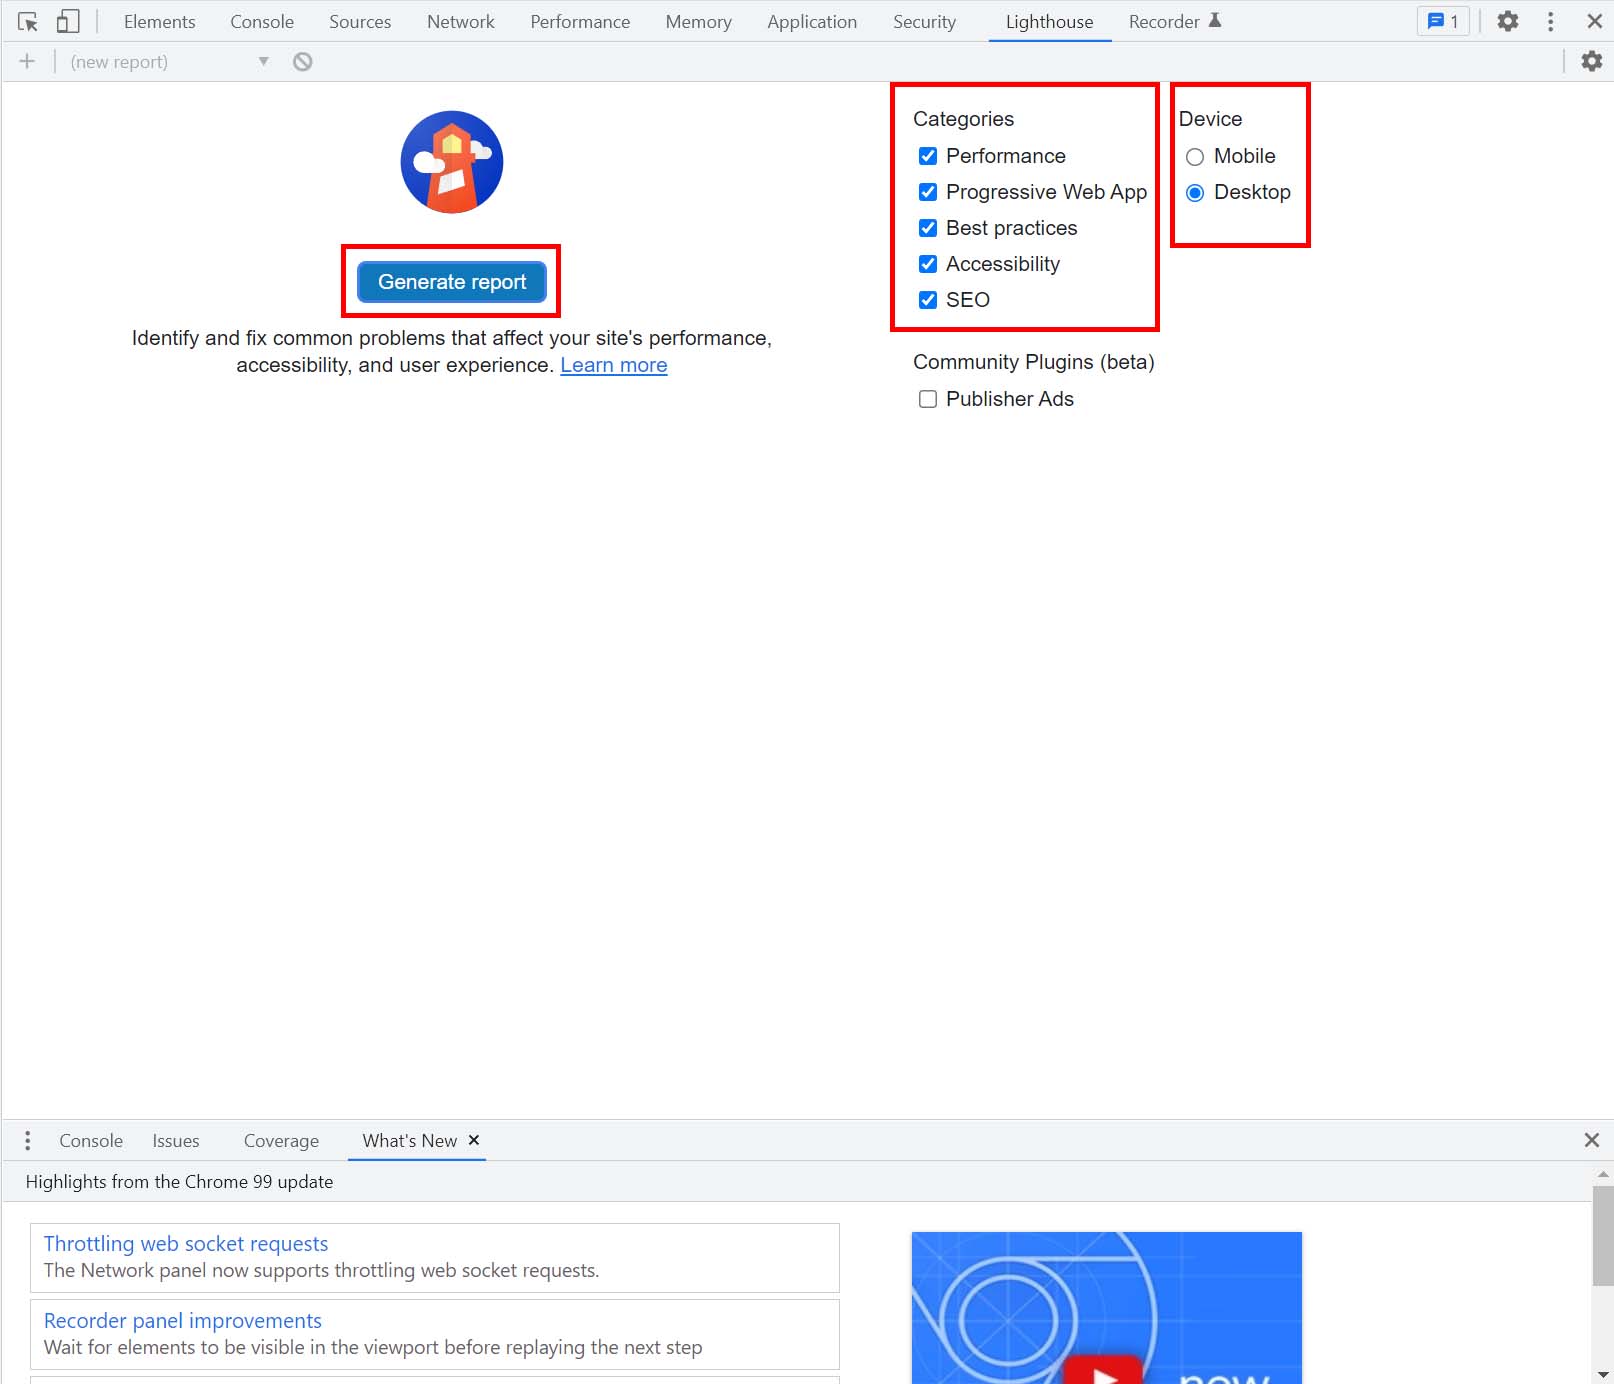
Once you have successfully opened the web developer tools window, simply click on the ‘>>’ button at the top of the navigation bar, which will bring up an additional dropdown menu and select ‘Lighthouse’, as highlighted in the image below.
Keep in mind that if you are using a monitor with a greater resolution, the option might already be visible to you (alternatively you can make the Lighthouse option appear by resizing the developer tools window).
You should have now arrived at the Lighthouse section, which at a first glance can appear to be quite empty. Don’t worry - there is plenty of information to cover here with relation to the fields, which are marked in red before we can proceed to obtaining some useful insights when it comes to our website’s experience metrics:
Understanding the Lighthouse interface and generating a report
Under the ‘Categories’ section, you will find a number of ticked boxes. These are all instructions to the tool that are used as a signal as to what categories the generated final-report needs to cover.
The more boxes you select, the better the feedback that you are going to receive for the given web page. Even though more options mean that the report will also take longer to generate, the delay usually boils down to nothing more than an extra couple of seconds. Due to this, you are advised to have all boxes checked in most cases, as the additional time is quite negligible.
Located on the right side of the categories section lay the ‘Device’ options. They are used to instruct the tool to generate a report by auditing the given web page as if a potential user had opened the particular web page using either a mobile device or through a desktop.
As a side note, Google as a search engine switched to mobile-first indexing a few years ago. Consequently, this switch made it absolutely necessary for webmasters to optimize their website to accommodate mobile traffic. Failure to do so could otherwise negatively reflect on their overall search results rankings.
Because of this, it is recommended that you generate one report using all of the categories for mobile and have the tool audit the given web page as if it were a desktop user as well. This will uncover a greater diversity of potential improvement areas.
In order to start the factor-evaluation process, simply click on the ‘Generate report’ button.
Getting acquainted with the results
When Lighthouse finishes auditing your web page it will present you with the results in the form of a well-structured report. Furthermore, it will also provide you with additional suggestions that you can implement in order to make positive changes to different sections of the evaluated web page.
The report itself is split into a number of sections each named according to the categories that you previously selected the report to cover. If you chose every single one of them as per our initial recommendation, then the report will feature the following sections:
- Performance
- Accessibility
- Best Practises
- SEO
- Progressive Web Application
Before we go ahead and discuss each one in slightly more detail, it is important to remember that this is only an introduction to the Lighthouse tool as we want to avoid overwhelming you with a lot of technical information and terminology. A more in-depth look at each section can be found in our other blog posts.
Performance metrics
The performance section contains information about the overall loading speed of the web page including the different factors that affect it. It is comprised of six distinct metrics, with each serving information about a different aspect of the audited page:
- First Contentful Paint (FCP)
- Largest Contentful Paint (LCP)
- Cumulative Layout Shift (CLS)
- Total Blocking Time (TBT)
- Time To Interactive (TTI)
- Speed Index
We have covered these metrics in more detail in our previous post specifically themed-around these user metrics basics. Some metrics can be easily comprehended just by looking at their name, while others are quite sophisticated and require a more in-depth explanation. However, in short, these metrics provide you with information about the largest visible element on the page, the speed at which the elements on the given web page are rendered as well as whether there are elements that randomly appear or shift their place without being invoked by an user’s action.
Furthermore, it is important to note that these factors related to the overall page loading time and speed, which are part of the indexing, could be improved with higher performance servers.
Accessibility
The accessibility report refers to how well the given web page is optimized in order to accommodate users that have a partial or permanent disability in relation to their hearing, sight or any physical restriction. This section of the report can provide you with some useful and insightful suggestions when it comes to making changes to your web page.
Examples include boosting contrast between certain page elements, changing theme, primary and secondary colors, incorporating voice search or implementing additional metadata to text and images that can be read-aloud by screen readers. However, while insightful, the accessibility section cannot fully guarantee you that it will be able to account for all user impairments due to their diverse nature.
Consequently, this means that you will need to perform some manual testing in order to discover and resolve further potential issues.
Best Practises section
Here, the tool primarily evaluates the security aspects of the given web page such as HTTPS headers, custom library vulnerabilities and properly implemented security tokens.
Moreover, it also audits the page for some of the more common mistakes that webmasters usually make, including some technical checks such as using deprecated libraries, forgetting to use images in an appropriate resolution.This section also brings up issues and errors that appear inside of the browser’s developer tools.
SEO - more helpful than you think
The SEO part of the report can significantly help you when it comes to making changes to your web page as it looks at the overall content and content is what search engines absolutely love. This section depicts what changes you can make to your web page in order to accommodate crawlers and potentially boost your page’s relevancy when it comes to the SERPs.
There are some useful suggestions relating to structuring your page’s title as well as appropriately sizing and naming your images. Furthermore, this report will also notify you about potential meta tags that you can incorporate on your page such as the all-mighty description, the canonical tag, which deals with duplicate content as well as the hreflang tag, which is used to notify crawlers that a given page is an identical translation of another page.
Finally, this section will also let you know whether your links are crawlable as well as whether the content of the web page has been blocked from being indexed either by a noindex tag or through the robots.txt file.
The final section - PWA, short for ‘Progressive Web Application’, is only of interest to you if your web page is actively playing host to such an application. However, there is a lot to be said about such apps. Because of this, we are going to dedicate a separate article in the future, in which we are going to go more in-depth on PWAs.
Things to remember about Lighthouse
It is absolutely vital to keep in mind that implementing all of the changes suggested by the tool does not guarantee you better ranking results. The report is primarily used as a benchmark for your web page that can help you identify potential areas for further improvement, which can, if implemented correctly and accordingly, lead to a better overall website score.
Web page and website ranking is a mixture of different factors, metrics and algorithmic calculations, performed in real-time when a search engine evaluates a user’s query, therefore each query will yield different results each time. All you can do is to optimize your page as much as possible in order to be eligible to appear to as many user search queries as possible.Want to learn more about each section of the report? Check out our previous articles and stay tuned as we are soon going to delve deeper into each part of the Lighthouse report!

